 |
||||
|
|||||||||||||||||
|
ARTICLES
NAVIGATION Commercial
|
|
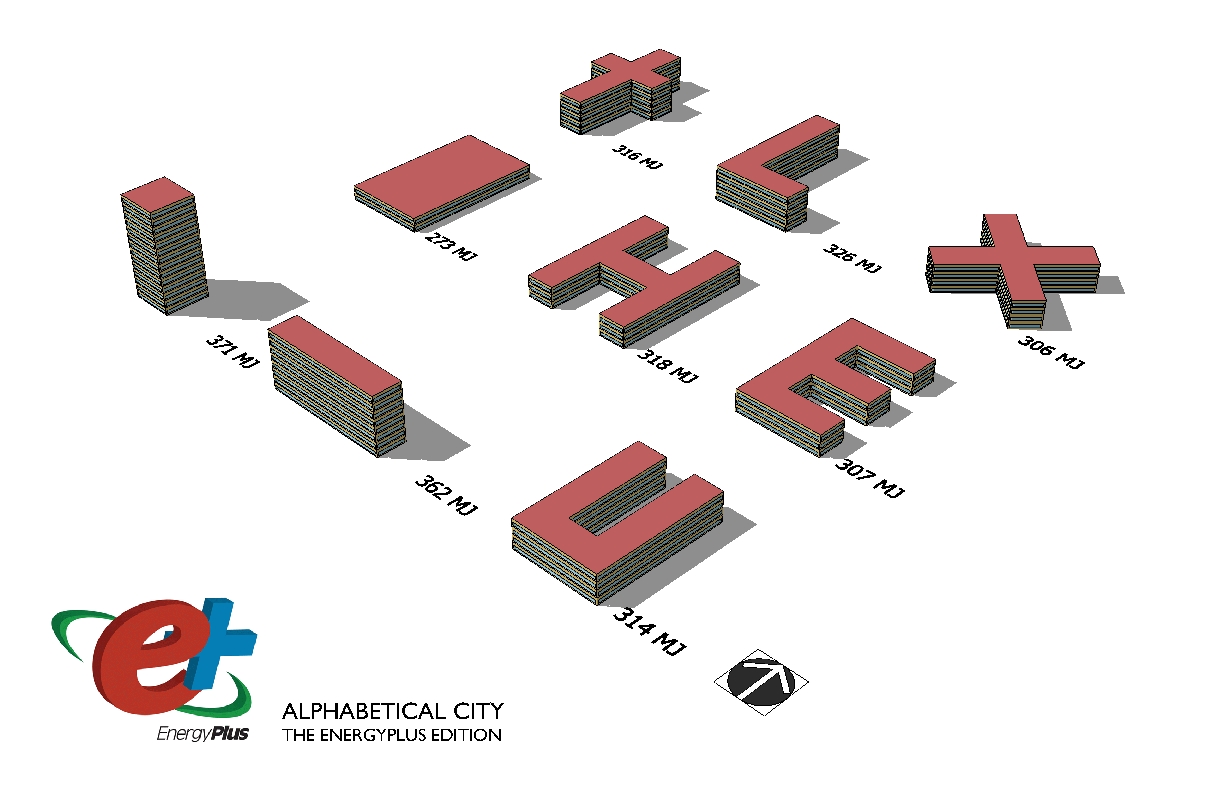
Designing Net-Zero Buildings with EnergyPlus Use Energy Modeling to Evaluate and By Philip Luo, Architect, LEED AP Updated February 9, 2011 to include ground source heat pump HVAC system and equipment plug loads. FIGURE A. ALPHABETICAL CITY ENERGY MODEL
1.0 Introduction Sometimes it can be difficult for Architects to participate in the design
of low energy buildings. During the integrated design process, Architects
can speak qualitatively about their ideas but cannot present quantitative
data to support their arguments. Therefore, it is easy for them to abdicate
leadership of the design to mechanical engineers, who are armed with a
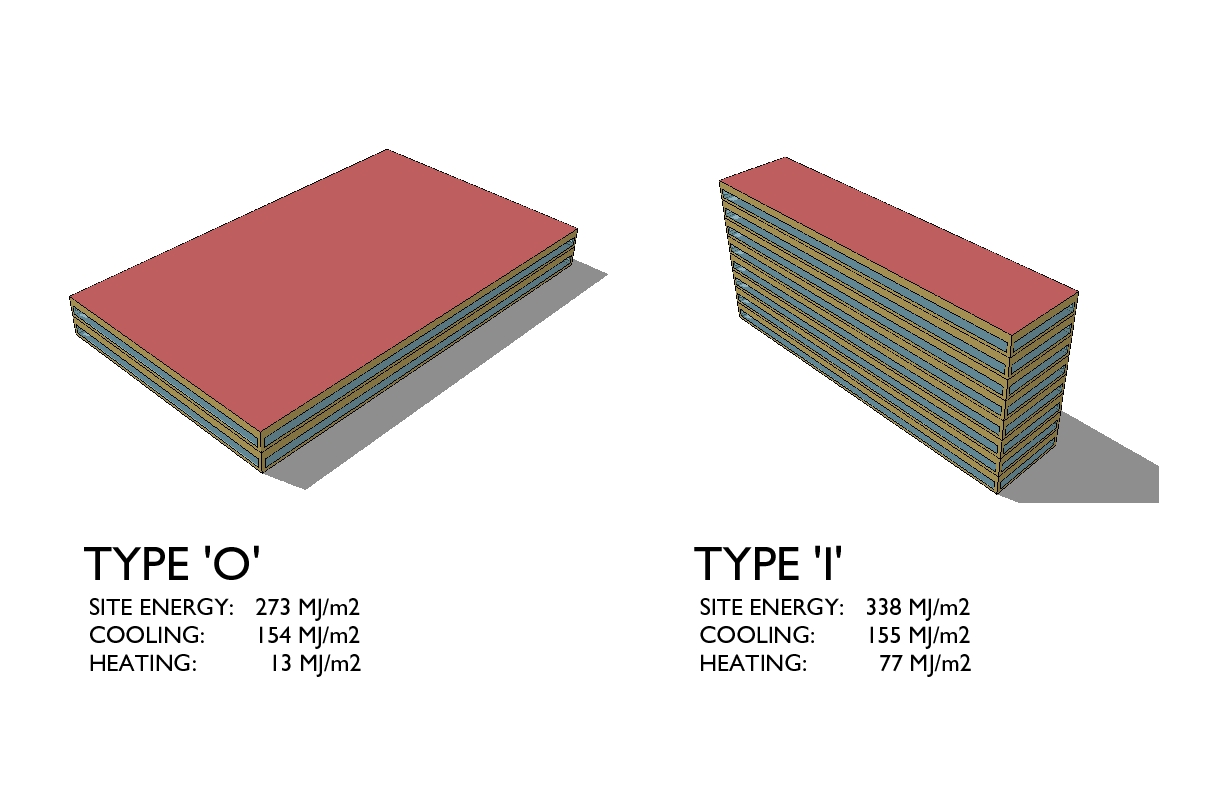
myriad of tools to support their ideas. 2.0 Layout & Baseline Energy Usage Building configuration and orientation are strategies that architects historically have employed to increase the energy efficiency of buildings. Energyplus (E+) allows architects to establish and compare the baseline energy usage of different building configurations using the same building material and construction. Figure A shows nine building layouts inspired by Steven Holl's pamphlet Alphabetical City4. All the buildings were designed with the same envelope construction: metal panel walls, green tinted insulated windows, and single-ply roof with R-15 insulation. The selected site for this study was San Francisco, CA. FIGURE B. BASELINE COMPARISON OF TYPES "O" AND "I'
With no sustainable strategy employed, the most energy efficient layout
is type 'O' (BO), the large floor plate rectangular building, with an
annual energy performance of 273 MJ/m2 (mega joules per meters squared).
The small perimeter to floor area ratio makes it an efficient building
to heat and cool with a traditional HVAC system. Conversely, type '.'
(square tower) with a high perimeter to floor ratio has the worst annual
energy performance at 371 Mega Joules per square meter (MJ/m2). With its
limited access to natural light, type 'O' is not an ideal building type
to use with many sustainable strategies. Although the type 'I' bar building
(BI) does not appear to be energy efficient in this initial study, it
does possess qualities that enable it to benefit from sustainable strategies
such as access to natural light and a large South elevation that can employ
solar shading to control heat gain. Therefore, this study will focus on
the bar building as the baseline building type to compare the benefits
of various sustainable strategies. TABLE B. BASELINE ENERGY USAGE
3.0 Solar Shading In warm and temperate climates, shading is an effective strategy for reducing energy usage. EnergyPlus can help a designer calculate the most effective sunshade configuration. This study uses as its baseline model a building with standard office glazing: ribbon windows with 30" sill height and 9' head height all around the building. Exterior windows used in the model are double glazed insulated windows with 6mm green tinted glass (SHGC= .049) and 13mm argon filled air space. FIGURE C. ENERGYPLUS MODEL OF TYPE 'I' BUILDING WITH SUNSHADES
TABLE C. ENERGY USAGE OF VARIOUS SHADING STRATEGIES
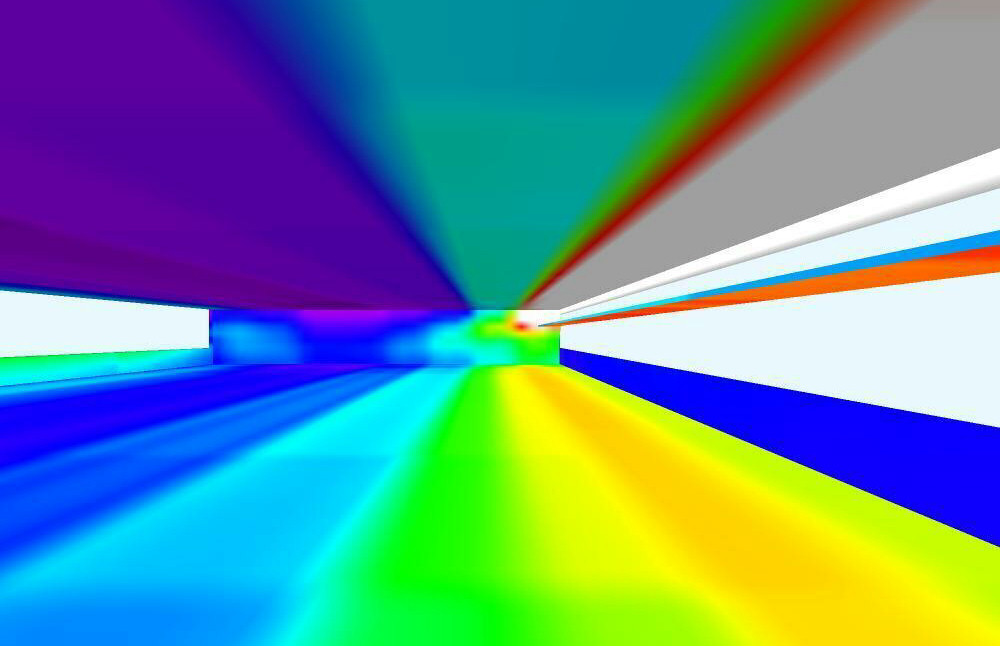
Table C compares the E+ results of three shading strategies to the baseline building (BI). Model (C1) utilizes only 30" deep sunshades along its South elevation. Shading the South elevation improves the building's energy efficiency by 13%. Model (C2) and (C3) illustrate two different strategies for shading the East and West elevations. Horizontal sun shades are only partially effective when used on the East & West elevations. The low sun angles of the morning and late afternoon sun make it all but impossible for horizontal shading devices to block out heat gain and glare. Model (C2) employs 30" deep sunshades on the East & West elevations and model (C3) uses no sunshades but reduces the size of East & West windows by 50%. In this study, reducing East & West window size (C3) outperforms sunshades. Overall, this study shows that an effective shading strategy can improve energy performance by 15%. 4.0 Daylighting Using daylight in lieu of artificial lighting can save energy two ways: from reduced electrical energy used by artificial lighting and from reduced heat gain from light fixtures. EnergyPlus can help a designer calculate the energy savings by reducing lighting energy. However, the lighting layout needs to be validated by a daylight simulation program to make sure that the illuminance level of program activities are maintained. For office uses, useful daylight is between 250 lux and 500 lux. Electric lights can be switched off when daylighting can provide 250 lux to a particular zone. Glare, another component of daylight, should be avoided. The discomfort of glare is usually solved by lowering shades. However, shade cloths and blinds can greatly reduce the effectiveness of daylight, therefore negating the benefits of having daylighting. FIGURE D. DAYLIGHT ILLUMINATION ON MARCH 21ST AT NOON
TABLE D. ENERGY USAGE OF VARIOUS DAYLIGHTING STRATEGIES
Table D shows the results of reducing lighting loads on the energy usage
in our energy model. Model (D2) shows that reducing artificial usage by
50% can produce a 25% savings in overall energy usage. Roughly stated,
model (D2) assumes that the building design can produce enough daylight
that will allow artificial lights to be switched off an average of 50%
of business hours (9am-5pm) all year. This assumption can be validated
using Sketchup and Dialux (a lighting design software). The designer can
use Sketchup to optimize the height of the clerestory windows, the depth
of the sunshades, and depth of the light shelf to allow the maximum amount
of daylight into the building while minimizing direct sunlight or glare.
Using criteria established in Sketchup, the designer can model the room
design in Dialux to validate the daylight illuminance at various times
of the year. 5.0 Envelope The building envelope controls how much heat enters or escapes from buildings.
EnergyPlus has advanced tools to customize materials and construction
of exterior walls and windows. Using these tools, the designer can test
sustainable strategies such as adding insulation, introducing thermal
mass at the perimeter, upgrading to low-e glass, and employing double
glazing facades. The success of these strategies depends greatly on climate
and location. For example, over-insulating and double facades are most
successful in Northern climates. Perimeter thermal mass is most effective
in year-round warm climates. Temperate climates, such as San Francisco,
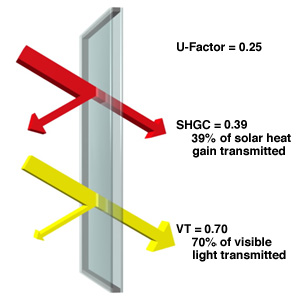
CA, requires moderate insulation but benefits most from improved glazing. FIGURE E. DOUBLE GLAZING WITH SPECTRALLY SELECTIVE LOW-E GLASS 6
TABLE E. ENERGY USAGE OF VARIOUS ENVELOPE STRATEGIES
6.0 Integration The sections above describe the impact of each sustainable strategy on energy usage. How much energy can be saved when all all strategies are employed together? Study F shows the cumulative impact of adding solar shading, reducing artificial lighting, and adding low-e spectrally selective glass. With all strategies employed, the potential energy savings is 34%. TABLE F. ENERGY USAGE EMPLOYING ALL STRATEGIES
7.0 Mechanical Systems A building's mechanical system has the single greatest impact on its energy usage. After employing all architectural strategies to improve the energy efficiency of a building, it is time to investigate energy savings through efficient HVAC systems. Sustainable strategies usually take advantage of natural resources to save energy. In the San Francisco Bay Area (California Climate Zone #3), the ground temperature provides a nearly free resource for cooling buildings. Six feet below the ground, the soil temperature varies between 51° F in the Winter to 60° F in the summer. A ground source heat pump can use the difference between the air and ground temperature to provide heating and cooling. Model (H4) depicts a building with a VAV system connected to a vertical ground source heat pump. The ground source heat pump reduces both cooling load in the Summer and heating load in the Winter. This system results in a 16% energy savings over the standard VAV system. For mechanical systems, pushing water through the building requires less energy than pushing air. More efficiency can be achieved by switching to a hydronic system. Model (H6) shows the same building as (H4) with radiant slab conditioning system with only a small air loop with heat exchanger to provide fresh air. Heating and cooling is also assisted by the use of a ground source heat pump. This system results in a 21% savings over the standard VAV system. TABLE H. ENERGY USAGE WITH EFFICIENT MECHANICAL SYSTEMS
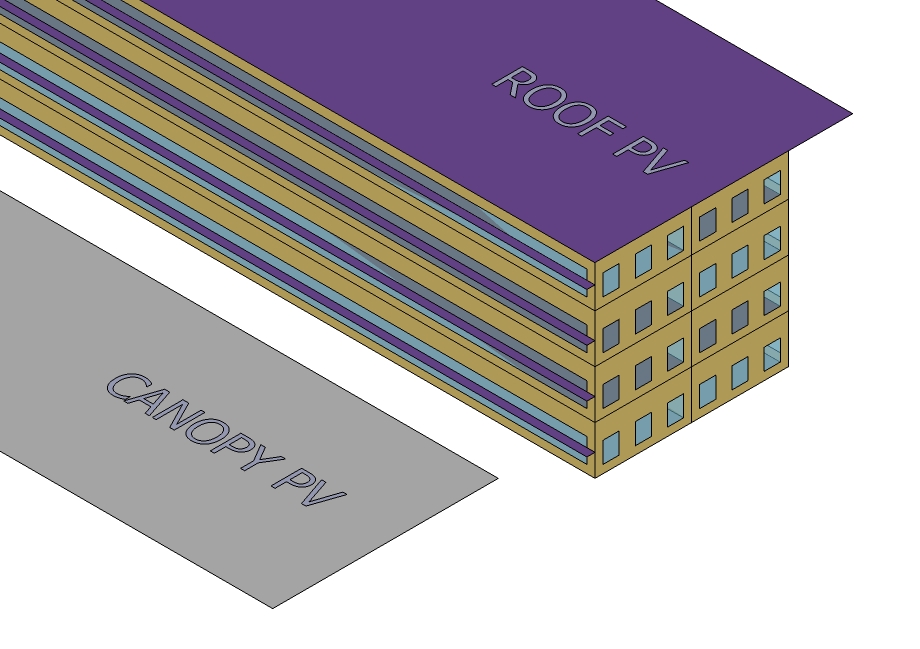
8.0 Power Generation & Plug Loads Once the designer has reduced the energy usage of a building, Energyplus
can help him/her calculate the area of photovoltaic panels required to
generate enough energy for a net-zero building. EnergyPlus Generator with
PV example file provides three different types of PV panels: simple, equivalent
one-diode, and Sandia (values provided by Sandia Labs). This study uses
a simple PV panel with 12% cell efficiency, fixed conversion efficiency,
and active cells on 50% surface area. In real life, the panel manufacturer
will provide data for photovotaic performance. FIGURE J. TYPE 'I' BUILDING WITH ROOFTOP AND CANOPY PHOTOVOLTAIC PANELS
TABLE J1. POWER GENERATION (BASELINE)
The energy usage of a building is not limited to the building's mechanical and lighting systems. A building's plug load or equipment load is a significant part of its electrical usage. Table J2 depicts the impact of plug loads on a Net-Zero Energy building. Model (J9) assumes a typical equipment load of 10 Watts per meter square or that of a medium density office7. The additional equipment increased energy usage not only for the electricity used for the equipment but also cooling for the heat generated for the equipment. The total energy used by the building increased by 50%. The overall PV Area to Floor Area Ratio for Net-Zero Building also increased from 51.5% to 78.1%. Designing a more efficient Net-Zero building requires the design team and the client to tackle electrical usage (lighting and equipment) more aggressively. In Model (J11), both the plug load and lighting load were reduced to 5 Watts per meter square (50% of baseline usage). The resulting Net-Zero building has a PV Area to Floor Area Ratio of 57.6%. TABLE J2. POWER GENERATION WITH PLUG LOADS (EQUIPMENT)
8.0 Conclusion Above is a description of this author's attempt to demonstrate how a Net-Zero Energy building can be designed on paper using EnergyPlus and DiaLux. Unfortunately, modeling does not necessarily translate into actual building performance. The reader is encouraged to work closely with the client and the design team to rigorously track energy usage and explore innovative ways to save energy. Hopefully, the innovations of designers today will someday make Net-Zero Energy buildings routine in the future. 9.0 Notes 1 http://apps1.eere.energy.gov/buildings/energyplus/2 http://apps1.eere.energy.gov/buildings/energyplus/openstudio.cfm 3 http://www.dialux.com/ 4 Holl, Steven, (1980), Pamphlet Architecture #5, The Alphabetical City, Princeton Architectural Press. 6 http://www.efficientwindows.org/lowe.cfm 7 http://www.in-posse.com/whitepapers/In Posse White Paper--Reducing Plug Loads.pdf Articles:
Design Studies:
Projects:
|
| © Copyright 2001 Philip Luo - All Rights Reserved, architecture pages | |||||