 |
||||
|
|||||||||||||||||
|
ARTICLES
NAVIGATION Commercial
|
|
Integrate Daylighting into the Case Study: Daylighting Design with DIALux By Philip Luo, Architect, LEED AP
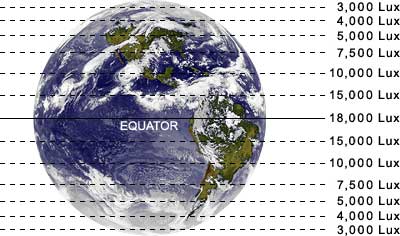
1.0 Introduction Daylighting is the use of natural light to reduce artificial lighting in buildings1. Artificial lighting accounts for up to 30% of the energy usage of typical office buildings. If you include the additional cooling required by heat generated by artificial lights, the total energy usage caused by artificial lighting could approach 50%. Using daylight to reduce the usage of artificial lighting can greatly increase the energy efficiency of buildings. This article will illustrate how Architects can use free and readily available tools to integrate daylighting into their building design. 2.0 Assess Daylighting Potential Daylighting requires illumination from exterior environment. The first step is to determine the light levels outside the building. Daylight comes from not just direct sunlight but also from illumination from the sky on overcast days. Figure 1 illustrates the Design Sky illuminance levels in different latitudes. Using the calculator on Autodesk Ecotect's website, we can also determine the recommended Lux levels for a particular latitude. The Design Sky illuminance levels "represent the horizontal illuminance value that is exceeded 85% of the time between the hours of 9am and 5pm throughout the working year. Thus they also represent a worst-case scenario that you can design to and be sure your building will meet the desired light levels at least 85% of the time."2 FIGURE 1A. DESIGN SKY ILLUMINANCE BY LATITUDE3
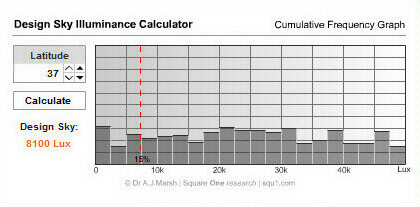
FIGURE 1B. DESIGN SKY ILLUMINANCE CALCULATOR TABLE 1. DAYLIGHT FACTOR4 (DF) CALCULATION
DF = 100 * Ein / Eext DF Daylight Factor Ein Interiior Illuminance (250 Lux) Eext Exterior Illuminance
Once the outside light level is determined, we can calculate the Daylight Factor to determine the feasibility of using daylighting in our design. Daylight Factor is a ratio of outside illuminance over inside illuminance. The Design Sky Illuminance Calculator in Figure 1 tells us that the outside illuminance at latitude 37 is 8100 Lux. The design interior ambient light level for office activity is 250 Lux. Table 1 tells us at the Daylight Factor (DF) for this scenario is 3.09%. 3% is within the acceptable range for daylit spaces. DF under 2% will feel gloomy, and DF over 5% could result in a design that is over-glazed, resulting in too much heat gain or heat lost. TABLE 2. GLAZING FACTOR (GF) CALCULATION5
The Glazing Factor (GF) Calculation (LEED version 2.2) is also a ratio of interior illuminance to exterior illuminance under overcast sky conditions. Unlike the basic Daylight Factor calculation, the Glazing Factor takes into account the window and skylight size and configuration in its calculation. Table 2 illustrates a hypothetical building with 5' high vision windows and 18" daylight windows on the North and South elevations. On the East and West elevations, 5' high vision windows cover 50% of the facade. Our hypothetical building achieves a Glazing Factor of 2.53%. These simple calculations show that daylighting can be employed without greatly compromising the comfort and energy performance of the building. 3.0 Solar Shading to Control Glare and Heat Gain Daylight design involves more than providing useful illumination in the building. Often, it has to address the negative side effects of natural light: glare and heat gain/loss. Glare comes from excessive contrast that usually results from direct beam sunlight striking interior surfaces. Unwanted heat gain occurs when sunlight enters the building on warm days. The solution to glare and heat gain comes in some form of sun control strategy that employs sun shades, light shelves, blinds, or shade cloth. The sun control strategy to use depends on climate and orientation of the facade. This article will study a building in the San Francisco Bay Area (Latitude 37.6). At this latitude, the shading strategy can be summed up as follows:
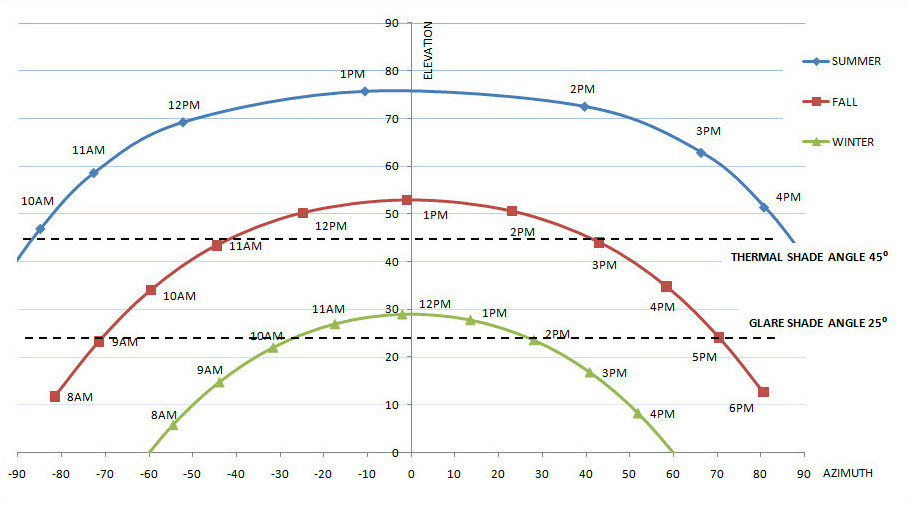
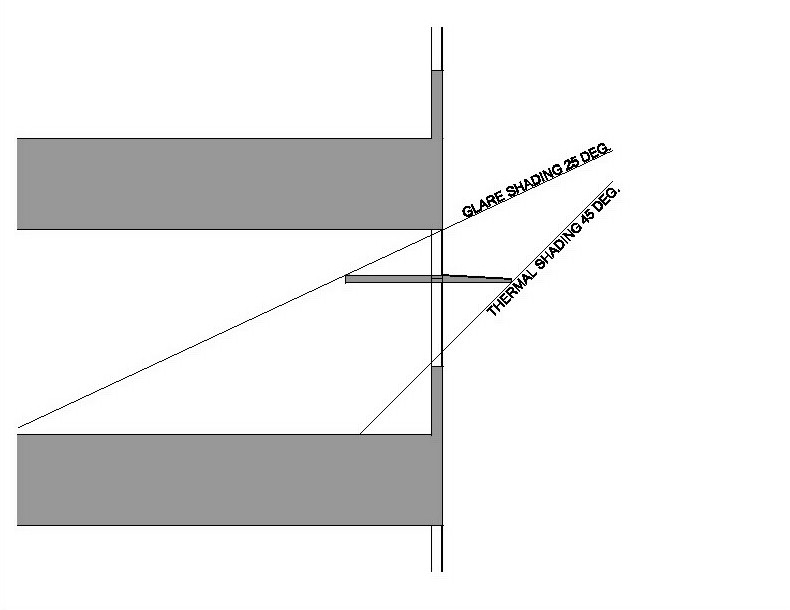
FIGURE 2. SUN PATH DIAGRAM (SOUTH ELEVATION)
The most common passive shading strategy uses a combination of sunshade and light shelf. Figure 2 shows the path of the sun from outside South facing windows. We can use this diagram to optimize our shading strategy. There are two reasons for shading: reduce heat gain and eliminate glare. These two criteria are expressed as dashed lines in Figure 2. Each dashed line expresses an angle above which the sun will be shaded. Thermal shading control heat gain in the summer and allow sunlight to warm the building in the winter. In Figure 2, the thermal shade angle is set at 45 degrees. In the summer, this angle will shade the window from 10am to 5pm. In the winter, this window will not be shaded at all. Solar thermal shading works best for sunshades above vision windows (windows between 2'-6" and 7'-6"). Glare shading prevents direct sunlight from striking interior surfaces, creating excessive contrast. Figure 2 shows the glare shade angle at 25 degrees. At this angle, direct sunlight is shaded from 9am to 5pm in the Spring, Summer, and Fall. In the Winter, direct sunlight is shaded from 10am to 2pm. Glare shading is usually used to control glare on daylight (clerestory) windows, glazing above 7'-6". Daylight windows, when used in conjunction with light shelves to shield direct sunlight from the building perimeter, bounce light off the ceiling to light up the building interior. The thermal shading line and glare shading line can be adjusted to meet the designer's criteria. We can balance the competing needs of more daylight and less glare/heat gain. Where the windows are not adequately shaded, users will usually deploy shade cloths to address thermal comfort and glare issues. Shade cloths, with 3-15% openness, usually filter out most of the useful daylight entering the building. Therefore, it is essential to design the sunshades and light shelves to optimize the amount of daylit hours to reduce the use of artificial lighting. FIGURE 3. SECTION OF SUNSHADE & LIGHT SHELF
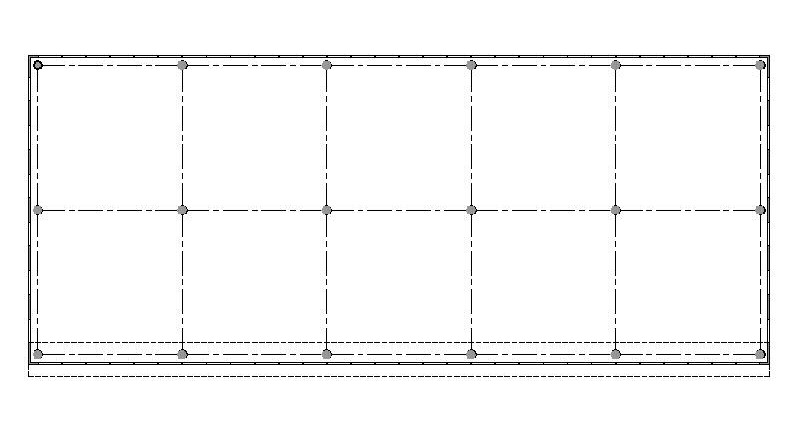
Figure 3 illustrates how the sunshade and light shelf could be designed to meet criteria set in Figure 2. Sunshades devices outside the building. In this illustration, the sunshade shields the vision window at a 45 degrees angle, keeping out heat gain and glare most of the day in Summer and Fall. Light shelves are inside buildings. They protect the building perimeter from direct sunlight and bounce light off the ceiling to light up the building interior. In this example, the light shelf is around 4 feet deep to prevent glare up to a 25 degree sun angle. As you can see from this illustration, the depth of the sunshade and light shelf can also be constrained by construction and code issues. Cantilevered sunshades require structural reinforcing to withstand wind uplift. Interior light shelves can obscure fire sprinkler distribution. 4.0 Daylight Modeling Computer software daylight modeling can be a very useful tool to analyze and optimize the daylighting design. Many software programs are available; most are free to use. The most commonly used software is the Unix-based Radiance Sythethic Imaging System6 developed by Lawrence Berkeley National Laboratory. Radiance is reputed to by very accurate; however, it is not easy to use. The simulation in this study was done using DIALux7, a professional lighting design software widely used in Europe. FIGURE 4. FLOOR PLAN
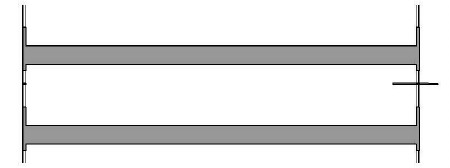
This study assumes a 60' wide rectangular building (Figure 4) in San Francisco oriented along an East-West axis. There are continuous ribbon windows along the North and South elevations from 3'-0" to 9'-0". The ceiling height as modeled is a standard 10'-0". FIGURE 5. BUILDING SECTION ALONG NORTH-SOUTH AXIS
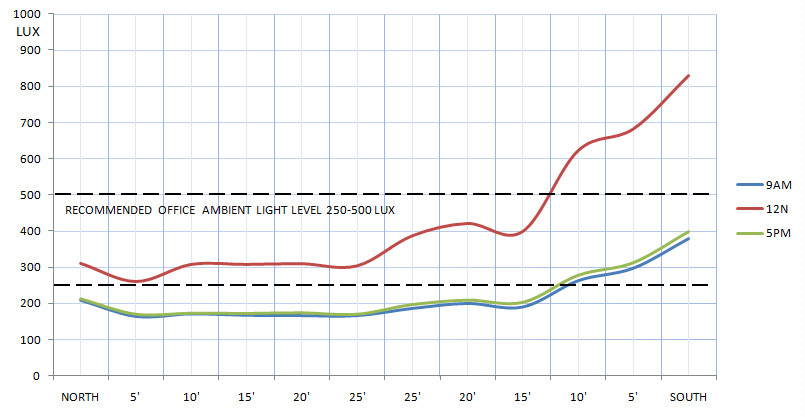
Figure 5 is a section of the building across the North-South axis. The North windows are unshaded. The South elevation has sunshades and light shelves as shown in Figure 3. FIGURE 6. ILLUMINANCE (LUX) ALONG NORTH-SOUTH AXIS (SUMMER)
Figure 6 depicts the illumination levels at three different times on a typical Summer day. The daylight properties were set for June 21st, the longest day of the year. Calculations were done for 9am, 12noon, and 5pm to gather data on daylight levels throughout the day. The simulation shows that the recommended ambient light levels of 250 Lux was achieved across the entire floor plate during the middle of the day. In the morning and late afternoon, designed light levels were achieved within 15' of the South windows and 10' from the North windows. It does appear that light levels of 200 Lux was achieved across the entire floor from 9am to 5pm. There could be significant energy savings from lighting in the Summer. FIGURE 7. ILLUMINANCE (LUX) ALONG NORTH-SOUTH AXIS (FALL)
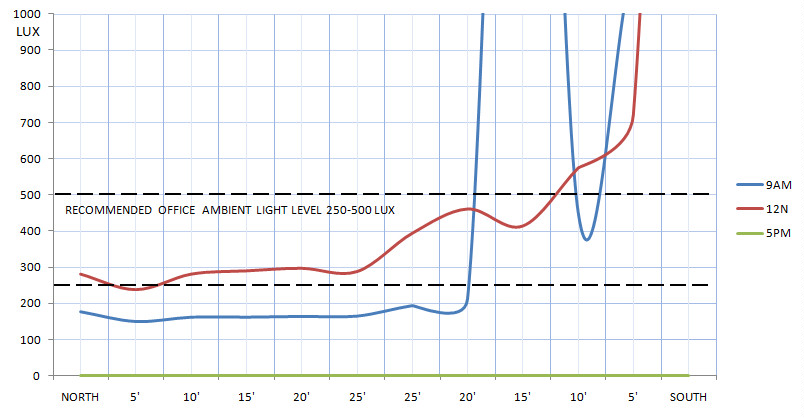
Figure 7 illustrates illumination levels on a typical Fall day. Daylight properties were set for September 21st (Equinox). In the middle of the day, the design light level was achieved with daylight alone. The South side of the building was able to achieve 200 Lux for most of the day. The North side had light levels below 200 Lux at the begining and end of the work day. It appears that there could be energy savings from lighting in the Fall and Spring as well. This simulation shows that the design could benefit from higher daylight windows and/or higher ceiling on the North side of the building. FIGURE 8. ILLUMINANCE (LUX) ALONG NORTH-SOUTH AXIS (WINTER)
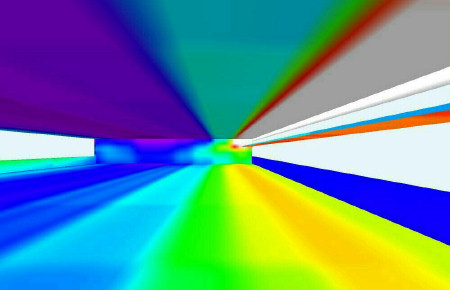
Figure 8. illustrates illumination levels on December 21st, the shortest day of the year. In the middle of the day, the design light level was achieved across the entire floor plate. Within 5' of South elevation, the illuminance level spiked up to 4400 Lux. There would be glare issues if workstations were place in this perimeter zone. At 9am, there was significantly high Lux levels on the South side of the building, indicated by the spikes on the graph. These numbers suggests direct sunlight falling on the workplane. During the morning, interior blinds or shade cloths would likely be deployed; therefore, there would not be any useful daylight. There could be some energy savings from daylighting in the Winter, especially during the middle of the day; however, due to the shorter days and low sun angles, the savings would not be significant. FIGURE 9. DIALUX FALSE COLOR RENDERING OF BUILDING INTERIOR
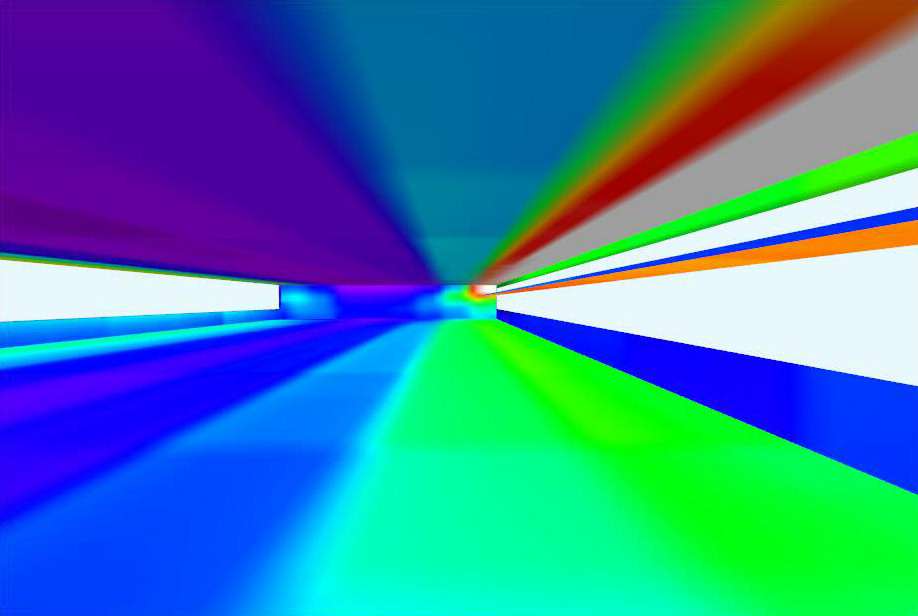
DIALux has many output options to help you visualize and understand data from your simulation. Output options include 3D rendering, False Color rendering, Workplane Photometric chart, and Workplane Isolines. Figure 9 is an example of a False Color rendering. It shows a 3D perspective view of the building interior with different colors assigned to preset illuminance values (Lux). FIGURE 10. DIALUX WORKPLANE PHOTOMETRIC CHART
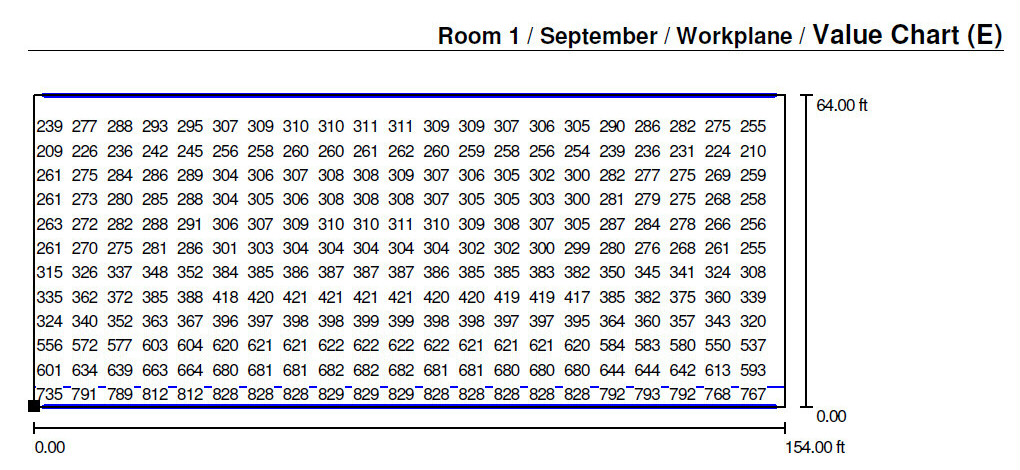
Figure 10 shows a Workplane Photometric chart. The workplane is typically set to 2'-6" above finish floor. The chart allows you to see the illuminance levels at various preset intervals across the entire floor plan. 5.0 Conclusion The proliferation of many open-source software and freeware designed for daylighting has lowered cost and skillset required for Architects to use daylighting in their design process. This article has only scratched the surface of tools one can use to analyze and simulate daylighting in buildings. However, with simple tools such as Excel, AutoCAD, DIALux, and many online resources, this study was able to assemble important data that could be used to improve the daylight performance of the building. 6.0 Notes 1 Gregg D. Ander, FAIA, (2008), Daylighting | Whole Building Design Guide, http://www.wbdg.org 2 http://squ1.org/wiki/Design_Sky 3 http://squ1.org/wiki/Design_Sky 4 Daylight Factors, CLEAR Comfortable Low Energy Architecture, http://www.learn.londonmet.ac.uk/packages/clear/visual/daylight/analysis/hand/daylight_factor.html 5 USGBC, 2006, LEED New Construction Reference Guide Version 2.2, EQ Credit 8.1, P.375 6 http://radsite.lbl.gov/radiance/ 7 http://www.dialux.com/ Articles:
Design Studies:
Projects:
|
| © Copyright 2001 Philip Luo - All Rights Reserved, architecture pages | |||||